
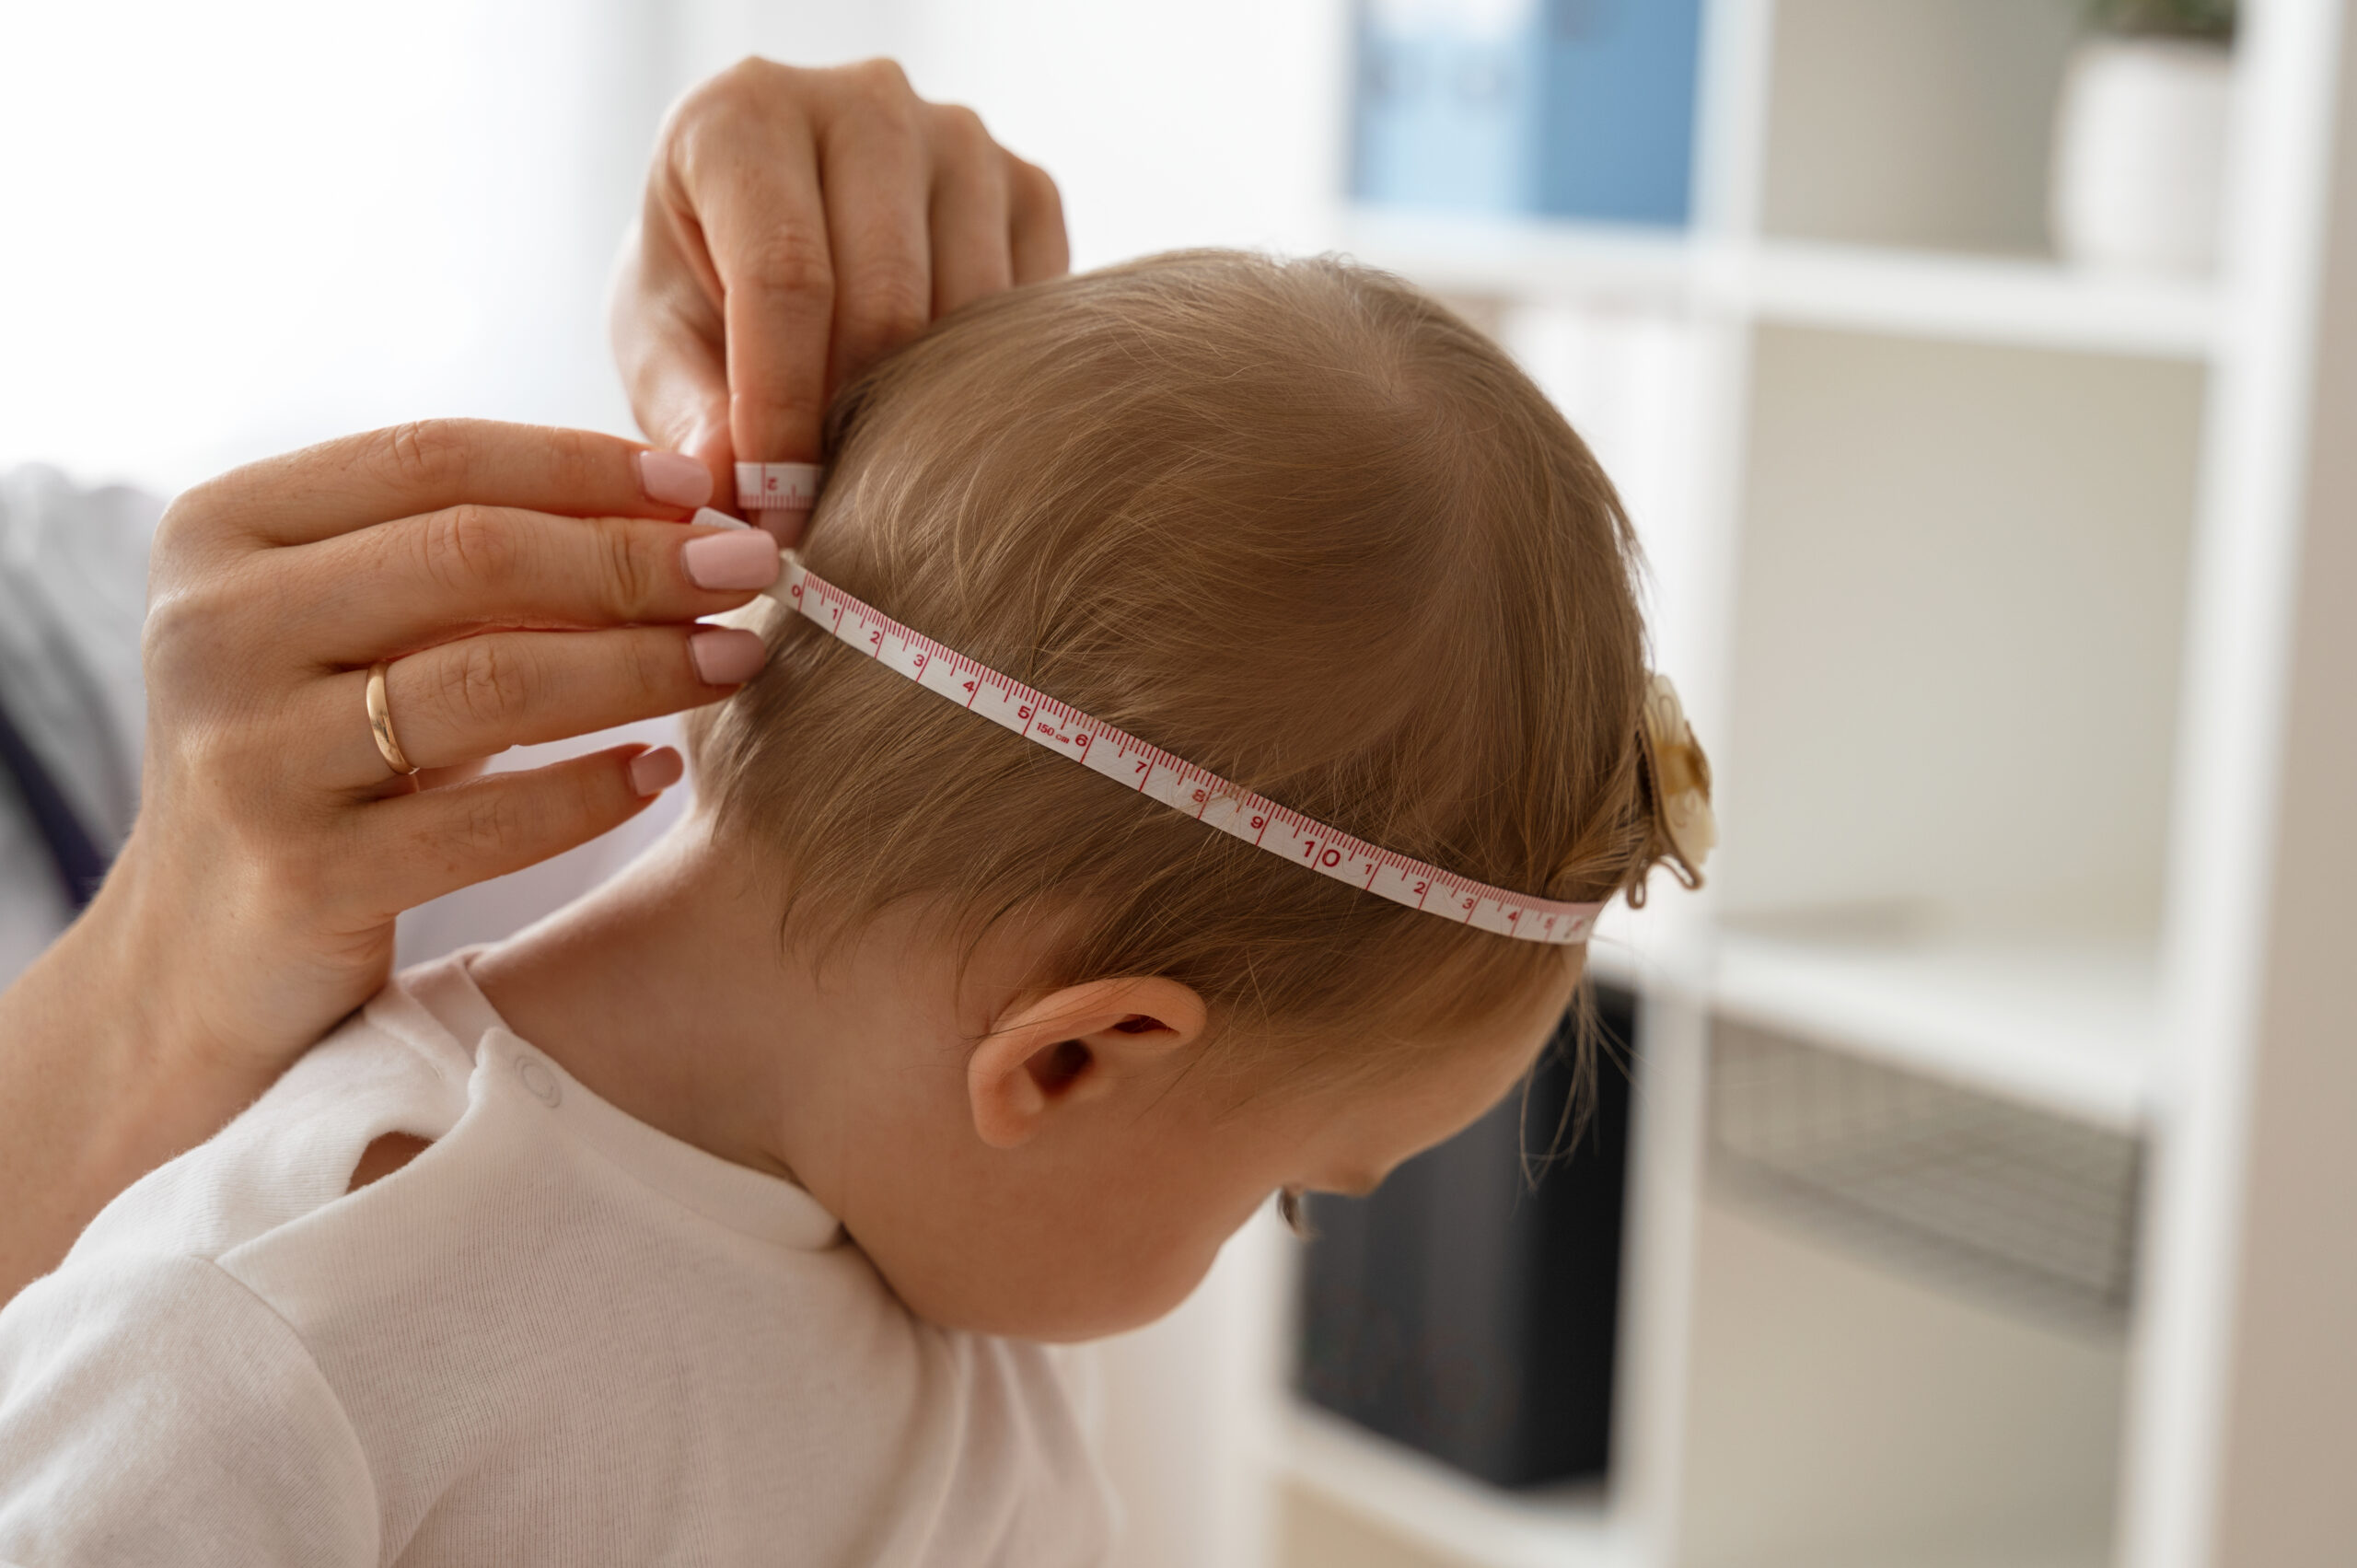

Curves and tables have been prepared for 13 anthropometric dimensions, pubertal stages, age at menarche and bone maturation standards, using a random sample representative of the entire country.
First, the distribution of the different dimensions was analyzed. A symmetrical, Gaussian distribution was confirmed for supine length, standing height, vertex-ischion length, sitting height, head circumference, biacromial and biiliac diameters, and foot length.
By contrast, the distribution was not Gaussian but asymmetrical, with a deviation to the right, for dimensions such as weight, arm, thigh and leg circumferences, and the three skinfolds. These data were adjusted through a logarithmic transformation.
With regard to weight and height, Cuban children living in rural areas have lower values than those living in urban areas, but the difference is not as large as that found in other countries. At seven years of age, the difference in height reaches about 2 cm. Differences were also found among provinces, the largest being between Havana and Oriente, where at seven years of age the difference in height reached 2.4 cm. Head circumference shows values very similar to those reported for children in Sweden and England.
National standards for weight and height show percentiles slightly below those reported for children in London, particularly during the first 10 years of life. From that age onward, the values begin to diverge, with Cuban children ending up about 4 cm shorter than English children.
However, when the height of Cuba’s national sample at seven years of age is compared with the United Kingdom national sample obtained from the follow-up of the 11,000 children in the perinatal study cohort at the same age, the values for the 3rd, 50th and 97th percentiles are practically identical.
At all ages, the weight of Cuban children is lower than that of children in London. This could have two explanations: either English children show a certain degree of overweight, or body-segment proportions are different.
Our studies have shown that Cuban children have longer legs and shorter trunks and heads than English children, probably because of African genetic influence. It is obvious that, at the same height and with the same distribution of fat and lean mass, individuals with longer legs and shorter trunks weigh less, because the two cylinders that make up the lower limbs are lighter than the solid cylinder that forms the trunk.
In addition, our studies have also shown that the biacromial and biiliac diameters are narrower in Cuban children.
With regard to skinfolds, in Cuban children of both sexes, the triceps skinfold always has lower values than that of English children, while the subscapular skinfold is very similar.
Since the British authors themselves consider their skinfold values to be relatively high and tending toward obesity, we compared our 50th percentile records with those of Swedish children and found that, at all ages and using the sign test, the triceps skinfold of Cuban children is thinner, while the subscapular and suprailiac skinfolds show higher values. This suggests a different distribution of fat in these populations.
Arm circumference has been considered a very useful and easy-to-measure indicator for evaluating nutrition in children, particularly between one and five years of age. The figure of 12.5 cm has been proposed as the lower limit for defining normality in children between one and six years old. The third percentile for Cuban children is always above this value at those ages.
With regard to sexual development during puberty, highly important data were found. An estimate was made of the distribution of age at menarche in girls from the national sample between 8 and 18 years of age, using the status quo method with logit analysis. The data were grouped in intervals of 0.1 year. The sample size reached 13,143 girls.
Age at menarche was also studied by province. The chi-square test for goodness of fit was not significant in any case, indicating that a logit line provided an adequate description of the phenomenon.
The stages of sexual development were studied in a total sample of 26,319 individuals: 13,861 girls and 12,458 boys between 8 and 19 years of age. The data were processed using a logit computer program analogous to the one used to calculate median age at menarche and its distribution, and were plotted on special paper with logit transformation. The cumulative percentages were fitted to a straight line.
The distributions were acceptably Gaussian according to the parallelism observed among the lines of the different stages, with the exception of stage 5. The standard deviation was 0.02 to 0.03 years for stages 2, 3 and 4.